Seventeen years of carrier-owned DAS shows up exactly where it should: indoors.
AT&T holds the strongest indoor 5G, Verizon delivers the cleanest signal quality, and T-Mobile —
with no in-building path — is the carrier the neutral-host cutover most helps. No gate is critical
for any carrier: 0 of 309 gate-carrier pairs measure below −110 dBm.
−90.5 dBm
AT&T venue 5G median · healthy at 95 of 103 gates (92%)
+12.5 dB
Verizon median SINR · healthy at 103 of 103 gates
−97.9 dBm
T-Mobile venue 5G median · healthy at 17 of 103 gates (17%)
AT&T
Strongest indoor signal; the DAS incumbent. Healthy 5G RSRP at 95 of 103 gates,
venue median −90.5 dBm, best 5G NR at 72 of 103 gates with all-carrier data. The current measurement
is the AT&T baseline the incoming neutral-host system must hold at parity.
Verizon
Cleanest quality; the LTE network of record. Median SINR +12.5 dB (103 of 103 gates
healthy — the most of any carrier), best-serving LTE at 76 of 103 gates, healthy LTE median −90.0 dBm,
and healthy 5G at 87 of 103 gates. New this window: best-NR honors across all of Concourse B and
indoor-stronger tenant medians with no recorded in-building system to explain them (section 8).
T-Mobile
Weakest indoors; the largest neutral-host lift. Healthy 5G at only 17 of 103 gates,
venue median −97.9 dBm, and the worst carrier at 93 of 103 carrier-asymmetry gates. The pattern is
consistent with no in-building path: T-Mobile rides macro spillover where AT&T rides the DAS.
A hosted T-Mobile path is the single largest measurable lift the Boldyn system can deliver.
Why this ordering holds
AT&T's attested DAS explains its indoor dominance; Verizon's clean quality and LTE strength come
from a strong macro/LTE layer reaching the building; T-Mobile shows neither. Deployment history
explains the ranking — and the ranking is reproducible from the tile export alone.
How to read this ranking — and how not to
Every ranking in this report is signal-layer: RSRP and SINR from an Android crowdsource panel. The
export contains no throughput, latency, or user counts, so it measures where signal is, not
whether a call or app fails. A strong-signal network can still be congested, and a mid-band network at
lower RSRP can out-carry a legacy DAS at higher RSRP. Section 13 states thresholds and caveats.
Section 2
Venue and transition context
Asset inventory · DAS transition
SEA is operated by the Port of Seattle (~25.4M annual enplanements; CIO Matt Breed
Imagine knowledge graph). The measured facts in this report sit on top of
one structural fact: the in-building system is changing hands.
| Element | Value | Notes |
|---|
| Airport | Seattle-Tacoma International (SEA / KSEA) | Port of Seattle · ~25.4M annual enplanements Imagine knowledge graph |
| Tile basis | 53,055 on-airport tile-aggregates | Clipped to the KSEA aerodrome from 245,114 exported · window 2025-08-01 to 2026-07-31 |
| Gate basis | 103 gates · 309 gate-carrier pairs | 80 m join to pinned OSM gate snapshot · every published cell n ≥ 30 |
| Tenant basis | 203 mapped venue points | OSM + Google Places tenant graph · pinned 2026-06 (Tier B) |
| Incumbent DAS | AT&T-owned, single-carrier, in service since 2009 | Contract expired 2024 · competitive RFP imminent das_master_feb2026 |
| Incoming DAS | Boldyn Networks neutral-host (2026) | Resets all three carrier positions · this report is the pre-cutover reference Imagine knowledge graph |
| Site layer | 250 Site Finder macro-site centroids | NEW this revision · Ookla-estimated technology-layer positions, not carrier registry data |
⬇ Download the full report (PDF · 27 pp · rev 2)
Ordered strongest-indoor first
Carriers are ordered by descending venue 5G median throughout this report. The table
summarizes the gate suite; the figures show the distributions behind the medians.
| Carrier | Venue 5G median | Healthy gates (5G) | Best 5G NR | Best LTE | Median SINR |
|---|
| AT&T | −90.5 dBm | 95 / 103 | 72 / 103 | — | +12.0 dB |
| Verizon | −91.9 dBm | 87 / 103 | — | 76 / 103 | +12.5 dB |
| T-Mobile | −97.9 dBm | 17 / 103 | — | — | see Fig. 2 |
Verizon's LTE median is −90.0 dBm. Dashes: the report publishes only the winning
carrier's count per best-network label. Full per-gate tables ship in the PDF appendices.
Fig. 1 · Venue-wide carrier medians · 5G RSRPSource · Ookla
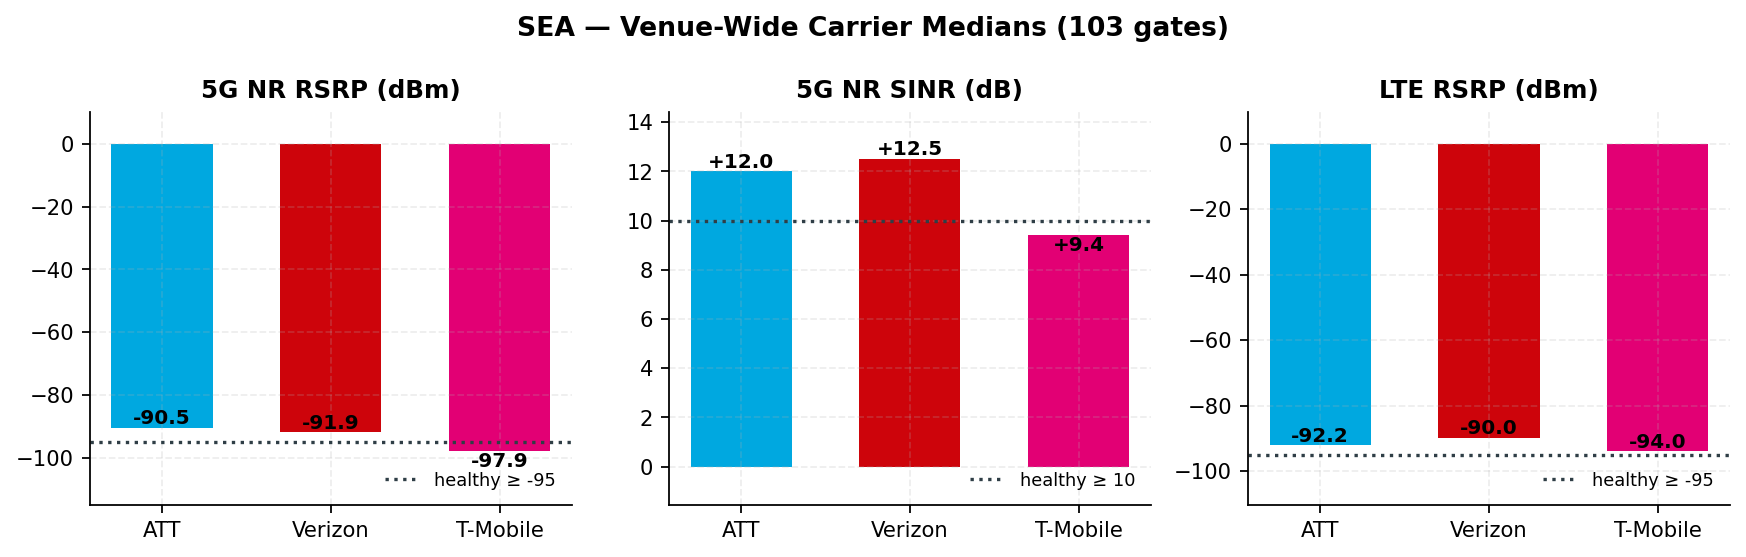
Locked ladder: healthy ≥ −95 · at-risk −95 to −110 · critical < −110 dBm. Window 2025-08-01 to 2026-07-31.
Fig. 2 · SINR distribution per carrierSource · Ookla
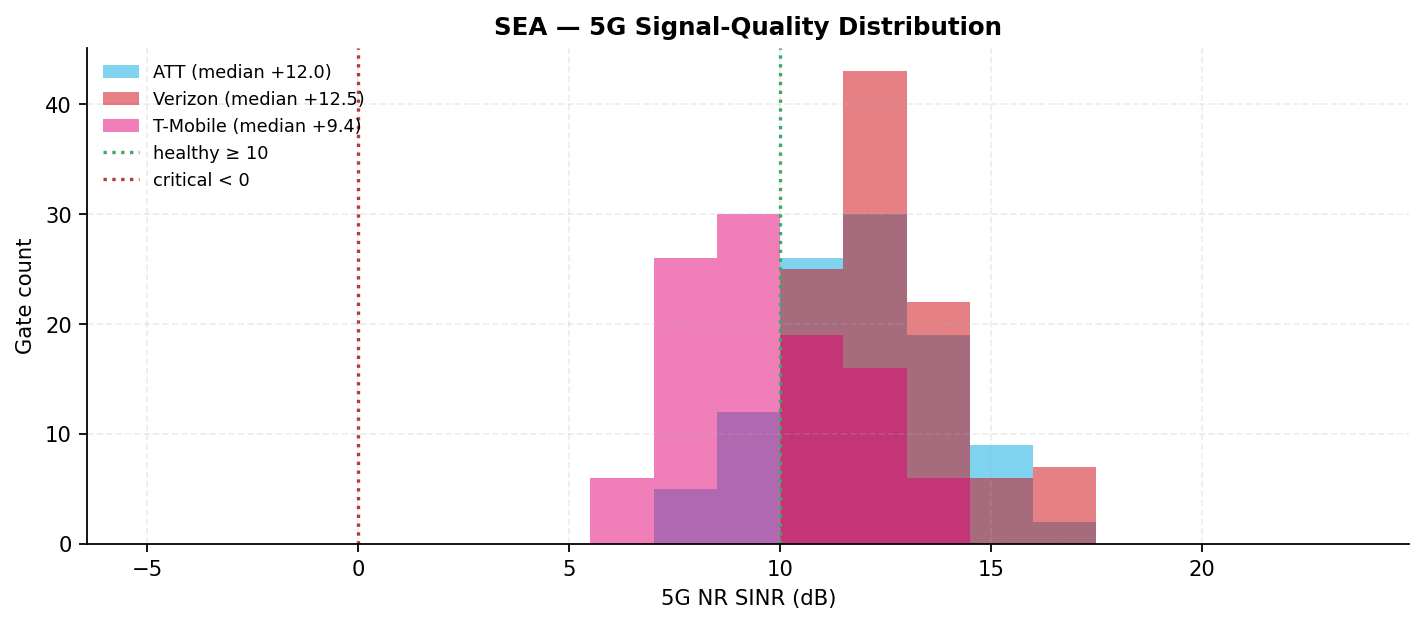
Verizon's quality lead is venue-wide, not localized. SINR healthy threshold ≥ 10 dB.
Section 4
Results by concourse
A · B · C · D · N · S
Concourse-level healthy shares and medians locate each carrier's gaps. The at-risk band
dominates T-Mobile across most concourses; AT&T holds majority-healthy distributions in the Alaska
hub. Critical-band gates (< −110 dBm): zero, for every carrier.
Fig. 3 · Healthy-gate share by concourseSource · Ookla
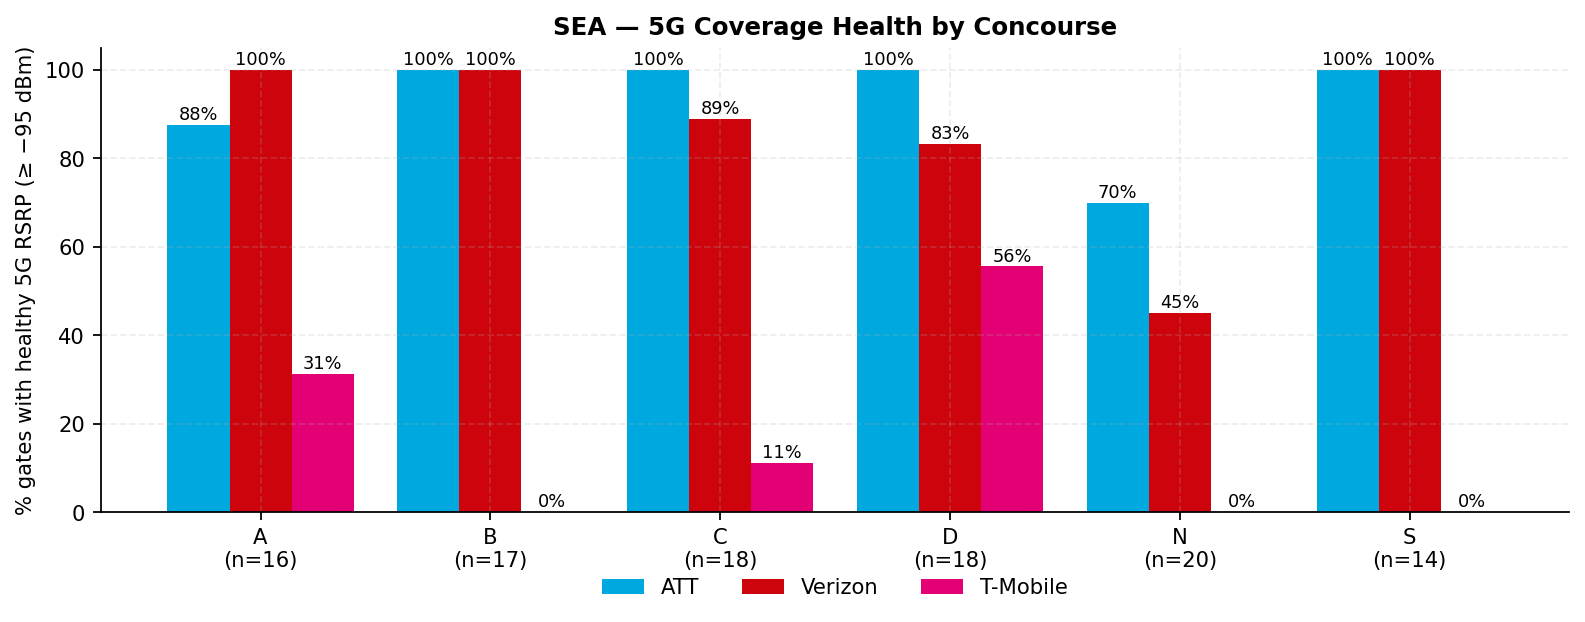
Fig. 4 · Median 5G RSRP by concourseSource · Ookla
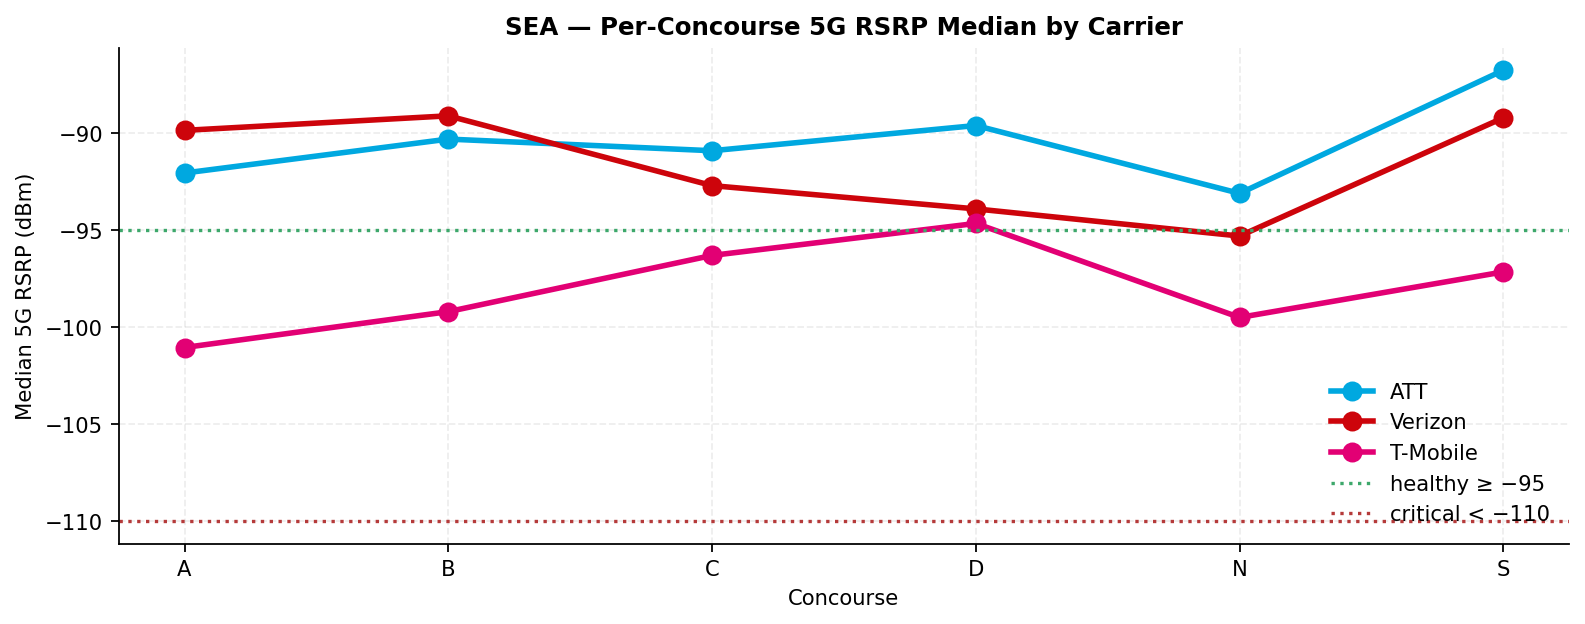
Fig. 5 · Coverage-class distribution by concourseSource · Ookla
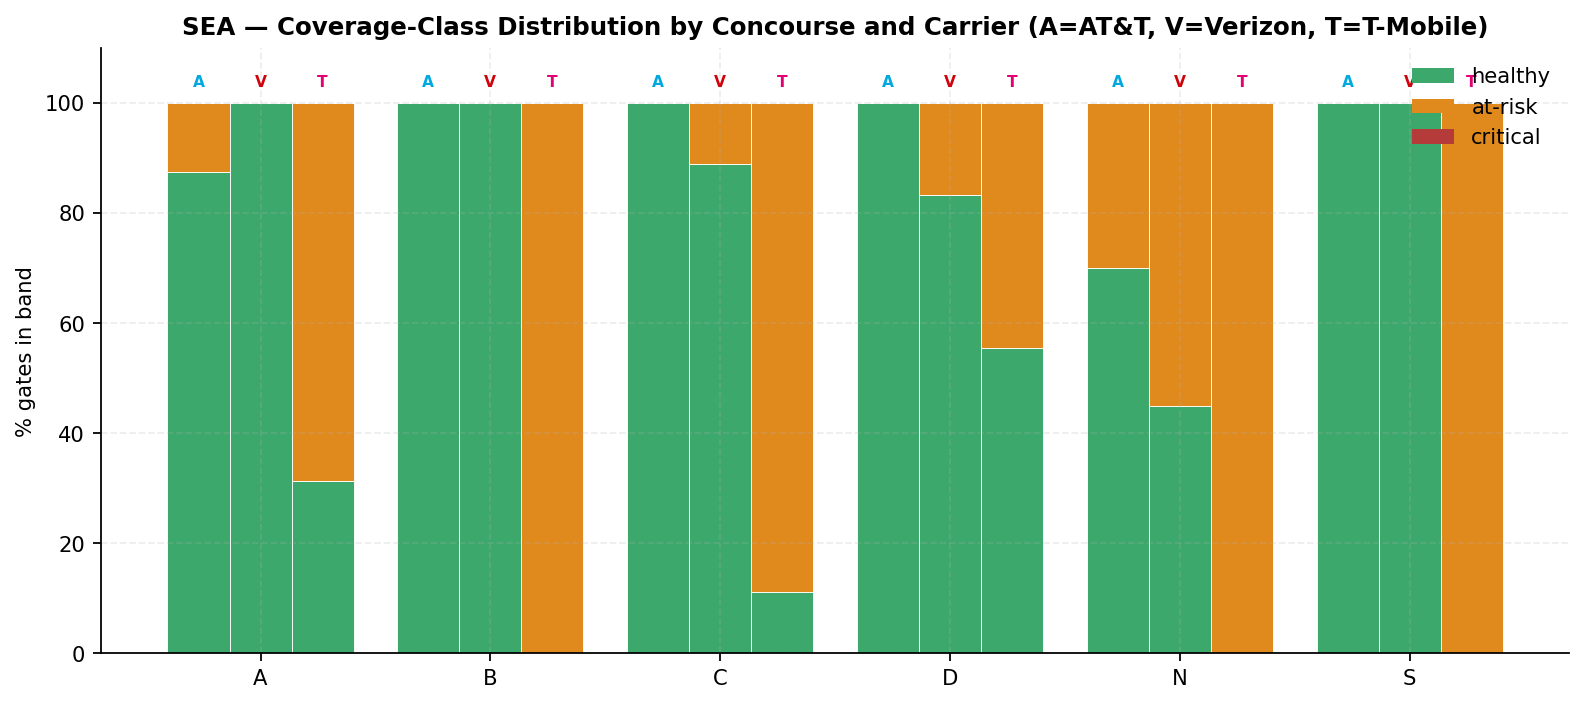
A = AT&T, V = Verizon, T = T-Mobile. n per concourse on the axis. Window 2025-08-01 to 2026-07-31.
Section 5
Cross-carrier concordance
Building problem or carrier problem
This is the split that decides who pays. A gate weak for all three carriers is a building,
geometry, or propagation problem — the neutral-host system's job. A gate weak for exactly one carrier
is that carrier's path problem.
At SEA the dominant pattern is one-or-two-carriers-weak with AT&T healthy — a
carrier-path problem concentrated in T-Mobile (and situationally Verizon), which is precisely the gap a
hosted neutral-host path closes. Zones showing all-three-weak gates price as propagation problems and
belong in the Boldyn design review.
Fig. 6 · Carriers below the healthy line per gate, by concourseSource · Ookla
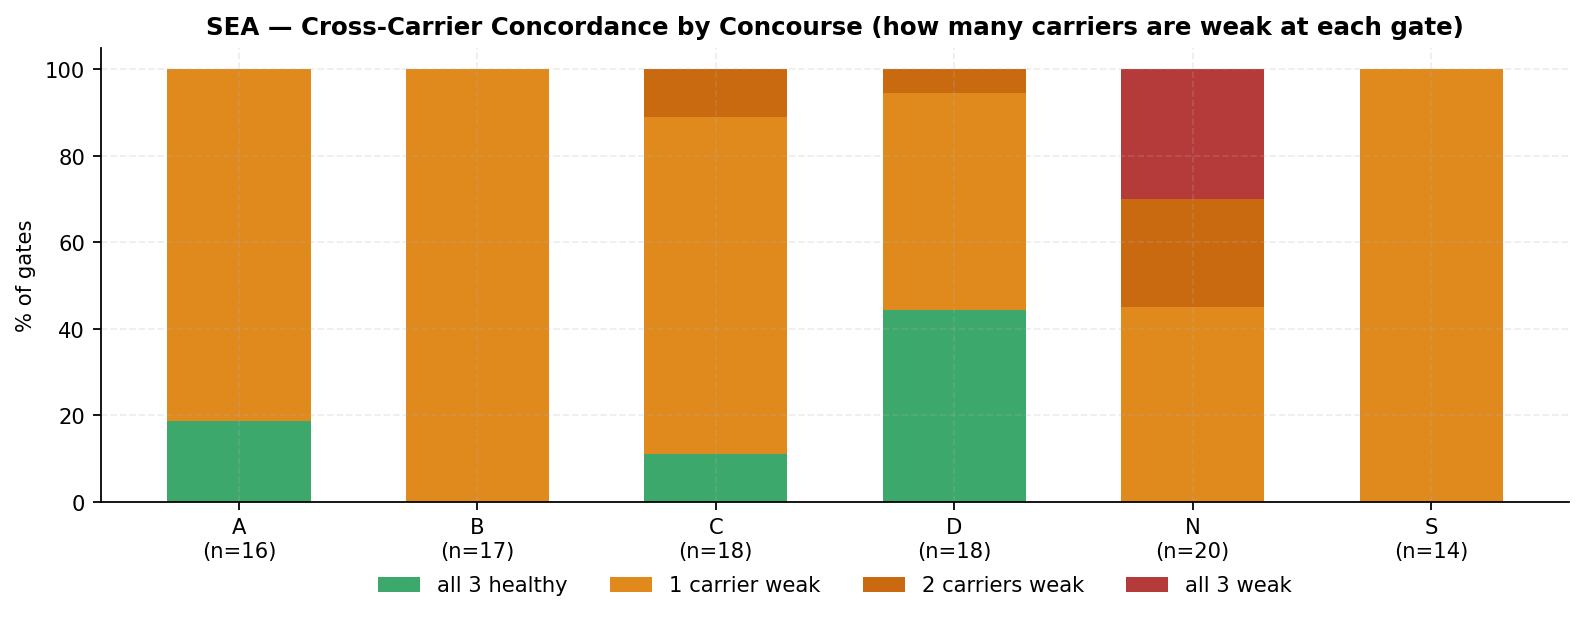
New section this revision (VNIR §4.3). Window 2025-08-01 to 2026-07-31.
Section 6
Alaska hub and South Satellite
38 hub gates · 14 international gates
Alaska hub — Concourse C + North Satellite
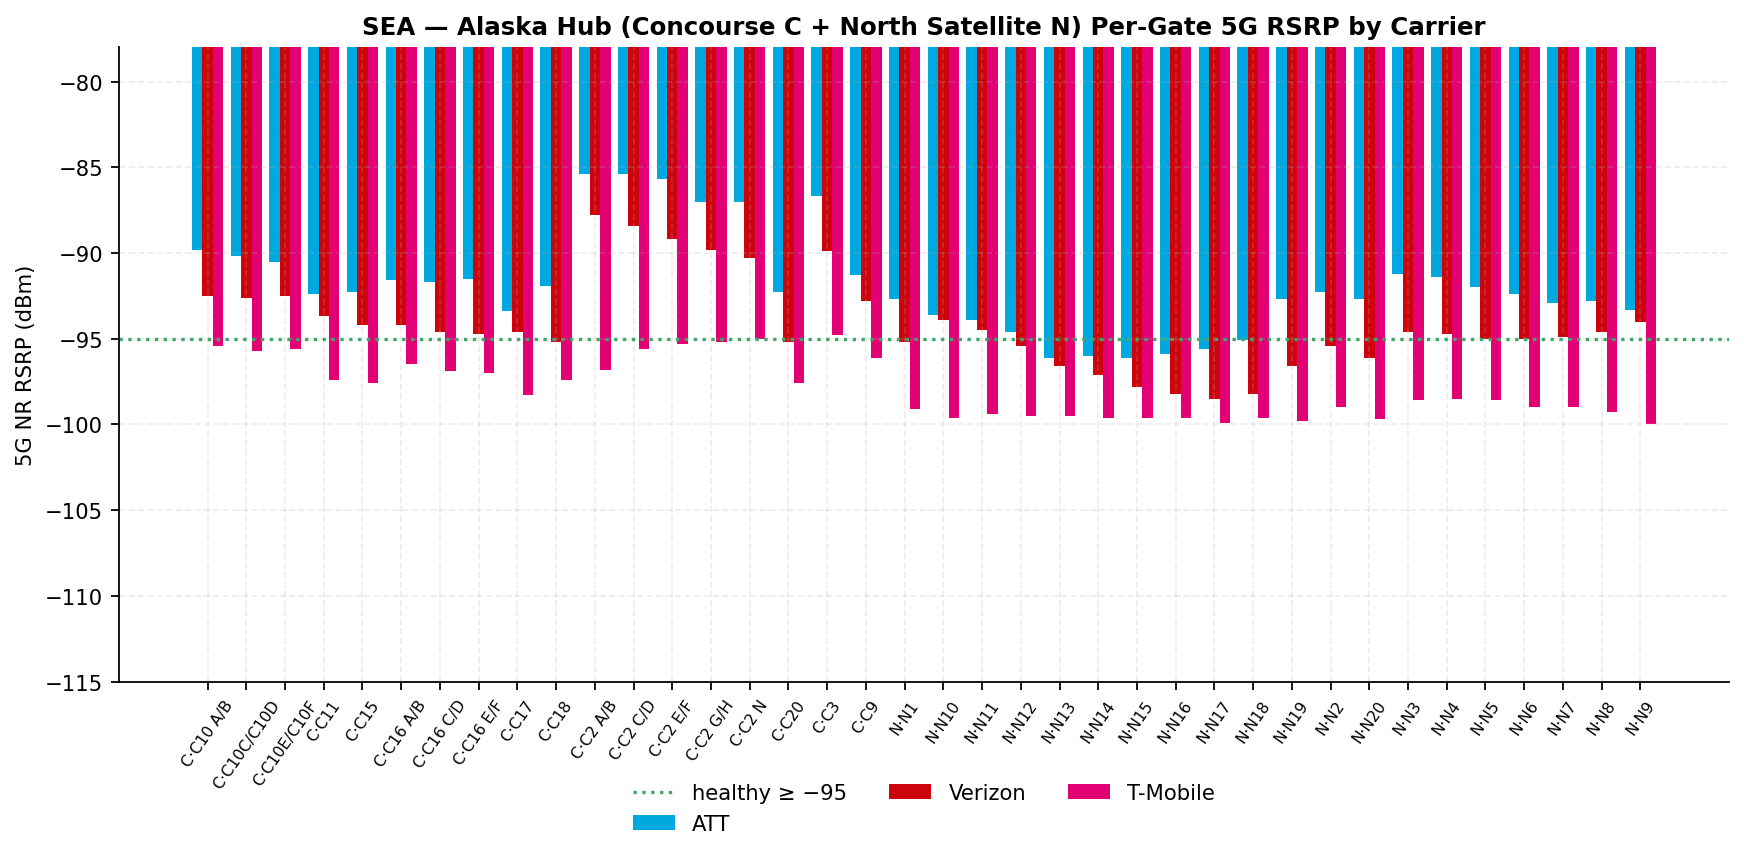
The Alaska hub is SEA's dominant single-airline cluster (38 gates; C expanded June 2026,
N is Alaska-exclusive). AT&T is best-NR at 38 of 38 hub gates with NR data and healthy at 32 of
38. T-Mobile and Verizon coverage in C and N should be named acceptance criteria in the Boldyn test
plan — those are the carriers riding macro spillover in the hub today.
Fig. 7 · Per-gate 5G RSRP · 38 Alaska-hub gates (C + N)Source · Ookla
South Satellite — international
The South Satellite hosts international premium-cabin traffic — the passengers with the
highest expectations and the least tolerance for a dead zone at the gate. Best-NR split across its 14
gates: AT&T 12 · Verizon 2.
Carrier coverage in S belongs in the post-cutover validation set.
Fig. 8 · Per-gate 5G RSRP · 14 South Satellite gatesSource · Ookla
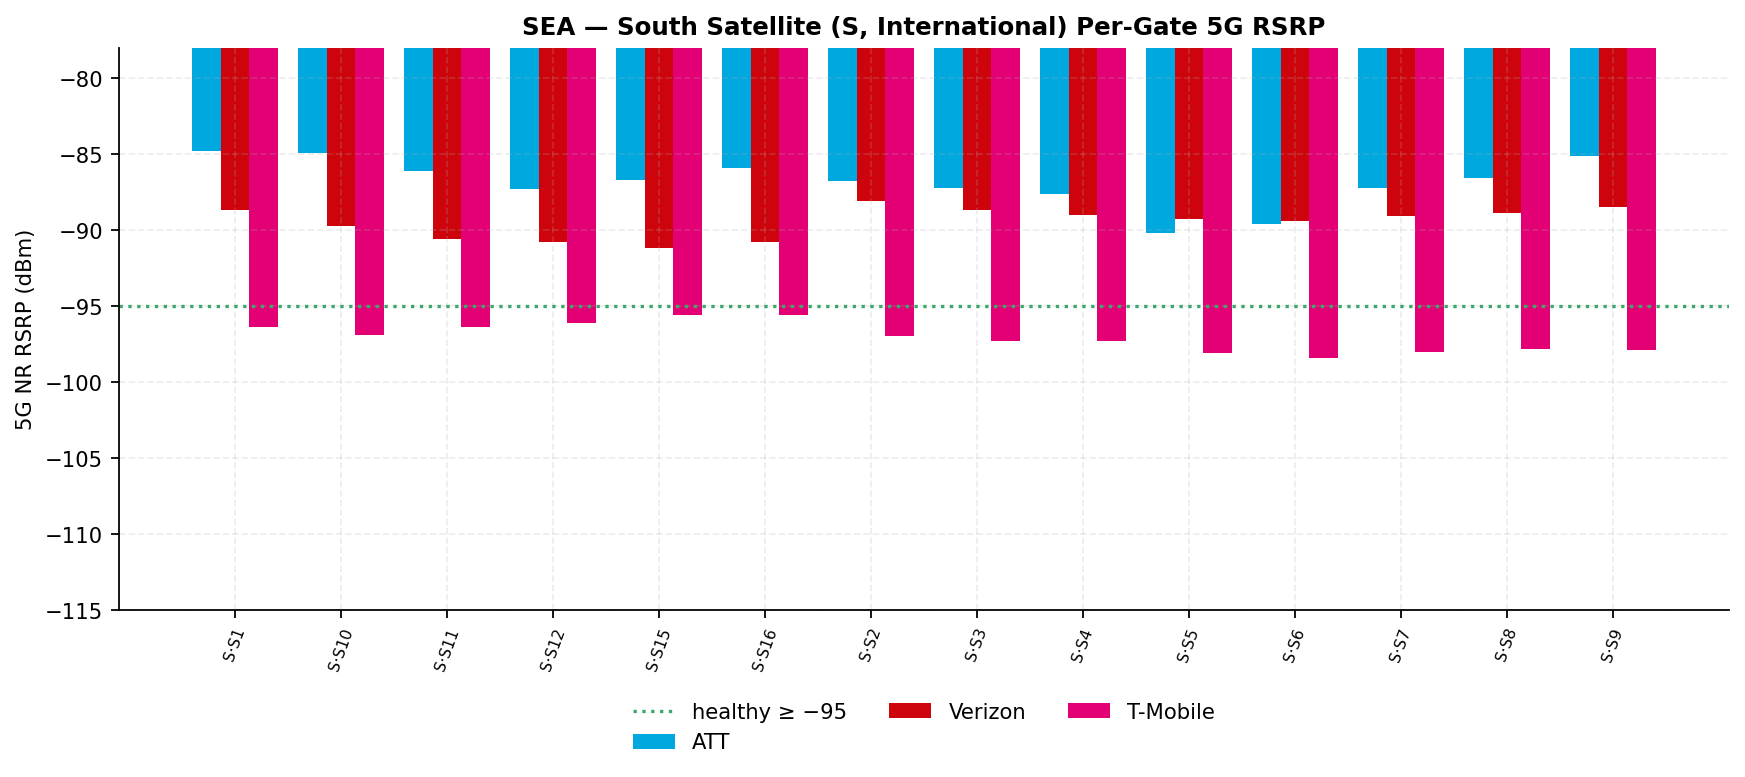
Foreign-flag carriers plus Delta international. Window 2025-08-01 to 2026-07-31.
Section 7
Indoor vs outdoor tenants
Donor-isolation diagnostic (proxy)
A large positive outdoor-minus-indoor delta is the macro-spillover signature; a flat or
negative delta indicates an in-building source. The three carriers split exactly along the deployment
story:
−0.4 dB
AT&T delta · outdoor −90.1 (n=63) → indoor −89.7 (n=137) · flat = in-building source
−6.0 dB
Verizon delta · outdoor −96.5 (n=62) → indoor −90.4 (n=140) · indoor-STRONGER (section 8)
+7.6 dB
T-Mobile delta · outdoor −91.3 (n=63) → indoor −98.9 (n=140) · macro-spillover signature
Fig. 9 · Median RSRP · indoor vs outdoor tenant categoriesSource · Ookla
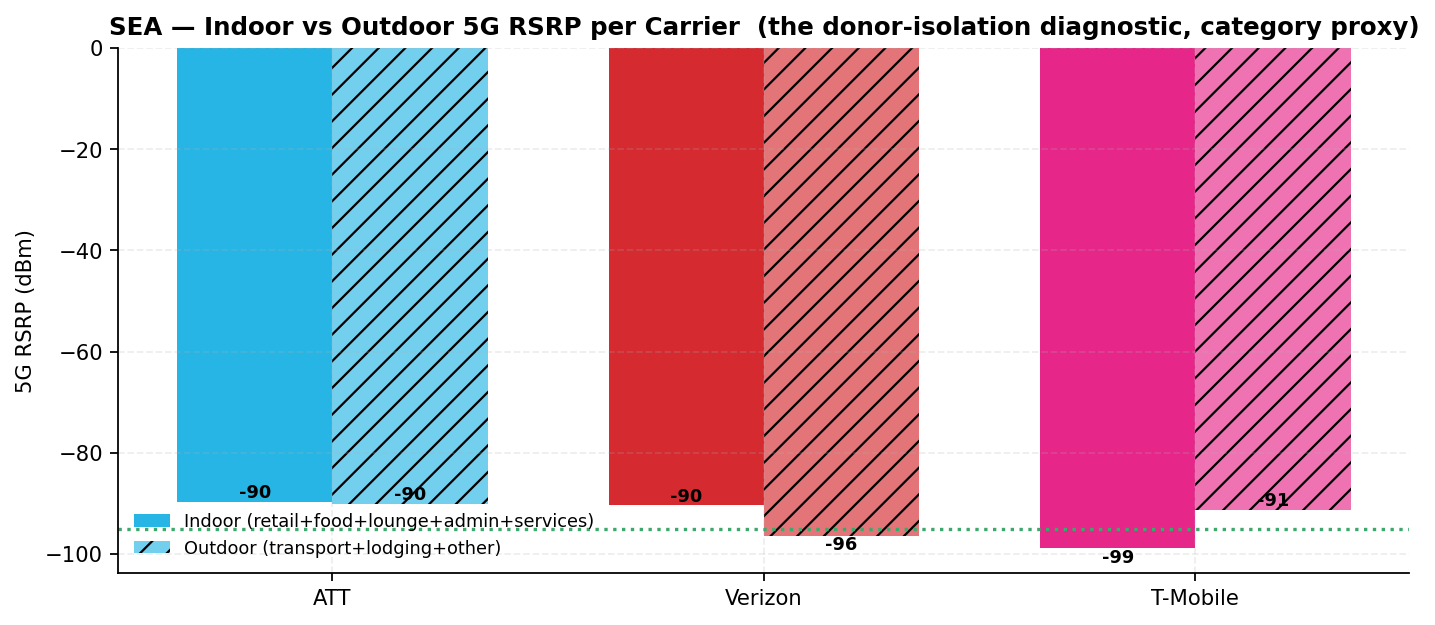
PROXY: category-based masking, not Ookla's native building-polygon indoor mask (queued as a next layer). Window 2025-08-01 to 2026-07-31.
Section 8
The Verizon attestation question
Finding F2 · pre-cutover risk
Verizon's rev-2 profile — best-NR at 17 of 17 Concourse B gates, indoor-stronger
tenant medians (−6.0 dB), the cleanest SINR in the venue — has no recorded in-building system to
explain it. The airport graph attests an AT&T DAS; it records nothing for Verizon.
This report deliberately does not explain the anomaly from tile data. It converts it into
an attestation question: locate, attest, and document whatever carries Verizon indoors — before the
Boldyn cutover decommissions legacy paths unexamined. An unrecorded independent path
decommissioned by accident is the largest transition risk in the record.
Why this is a question, not a finding
Tile aggregates measure signal, not infrastructure. The indoor-stronger pattern is consistent with an
unrecorded in-building path, a re-tuned donor arrangement, or panel bias — the export cannot separate
these. The resolution is documentary (as-builts, attestation), not more tiles. See recommendation 3.
Section 9
Spectrum and macro-site geometry
NEW · Site Finder layer
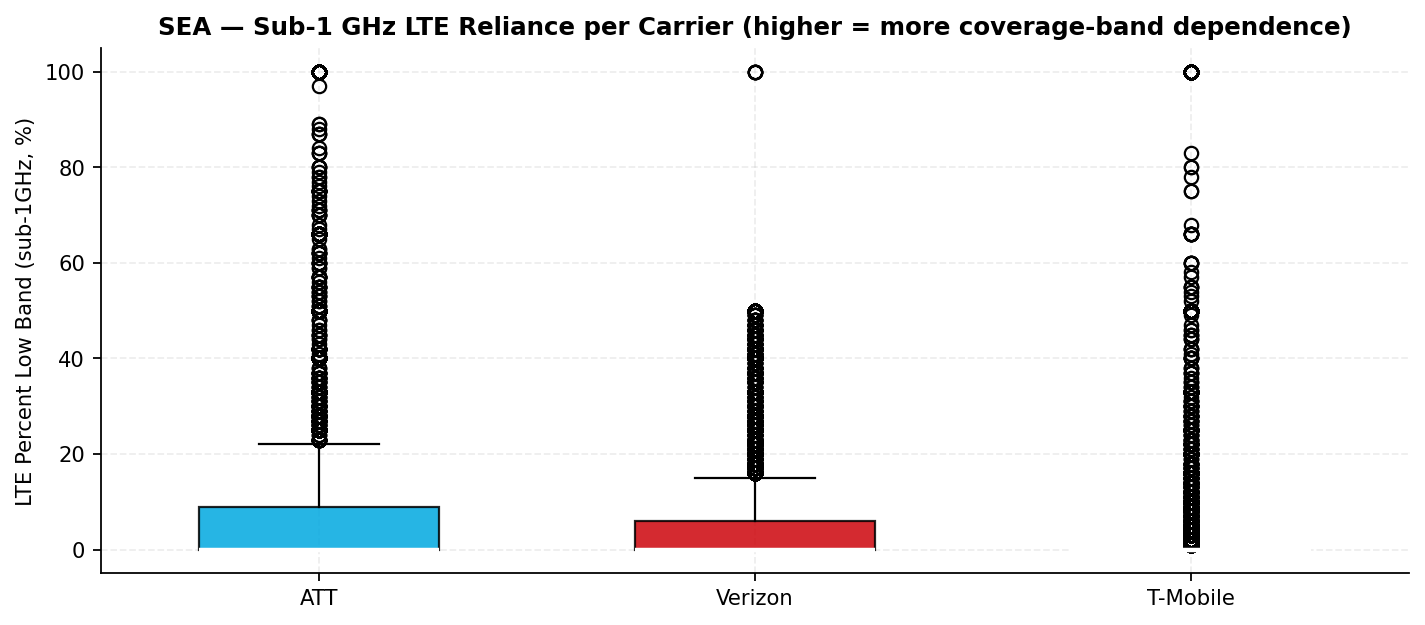
The percent-low-band statistic is an indirect indicator of in-building dependence: a
carrier whose tiles disproportionately attach to sub-1 GHz spectrum (600/700/850 MHz) is leaning on
coverage-grade bands because higher-capacity mid-band is not reaching the tile reliably.
Fig. 10 · LTE percent-low-band distribution per carrierSource · Ookla
Macro-site geometry — new this revision
The Site Finder layer resolves the macro grid each carrier rides where it has no
in-building path. Around the aerodrome: Verizon 112 estimated sites
(nearest 550 m — the densest grid), T-Mobile 71 (nearest 733 m),
AT&T 67 (nearest 414 m). Centroids are Ookla-estimated
technology-layer positions derived from crowdsourced RF — estimates, not carrier registry data; LTE
and NR layers on one structure appear as two entries.
Fig. 11 · Estimated macro-site positions vs the KSEA aerodrome · site-distance distributionSource · Ookla Site Finder
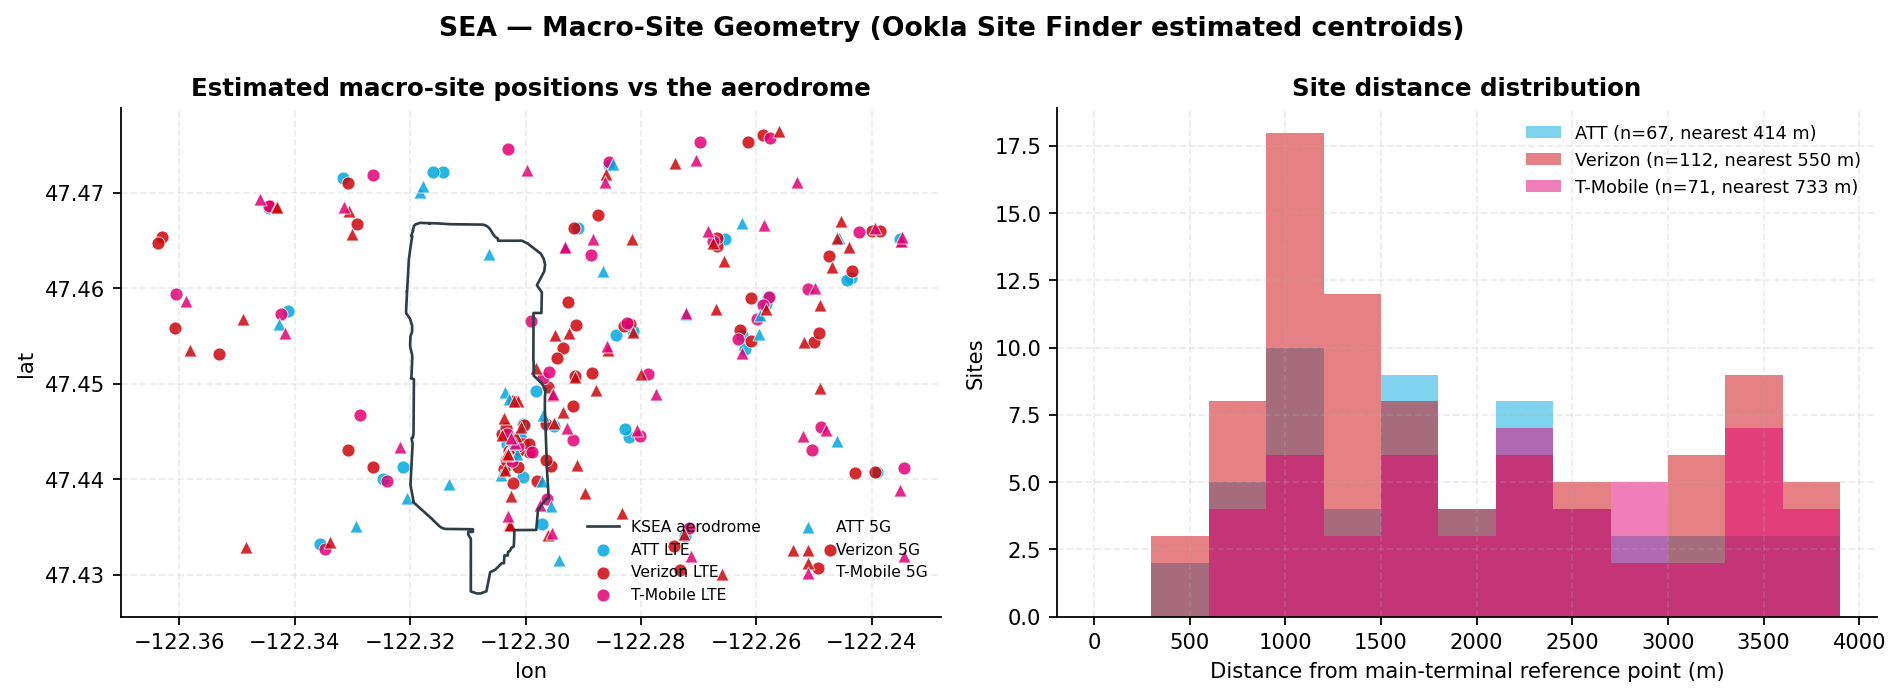
Distances computed to a disclosed main-terminal reference point. 250 centroids, big-3 technology layers.
Section 10
Data usage and Wi-Fi offload
Venue and zone level only
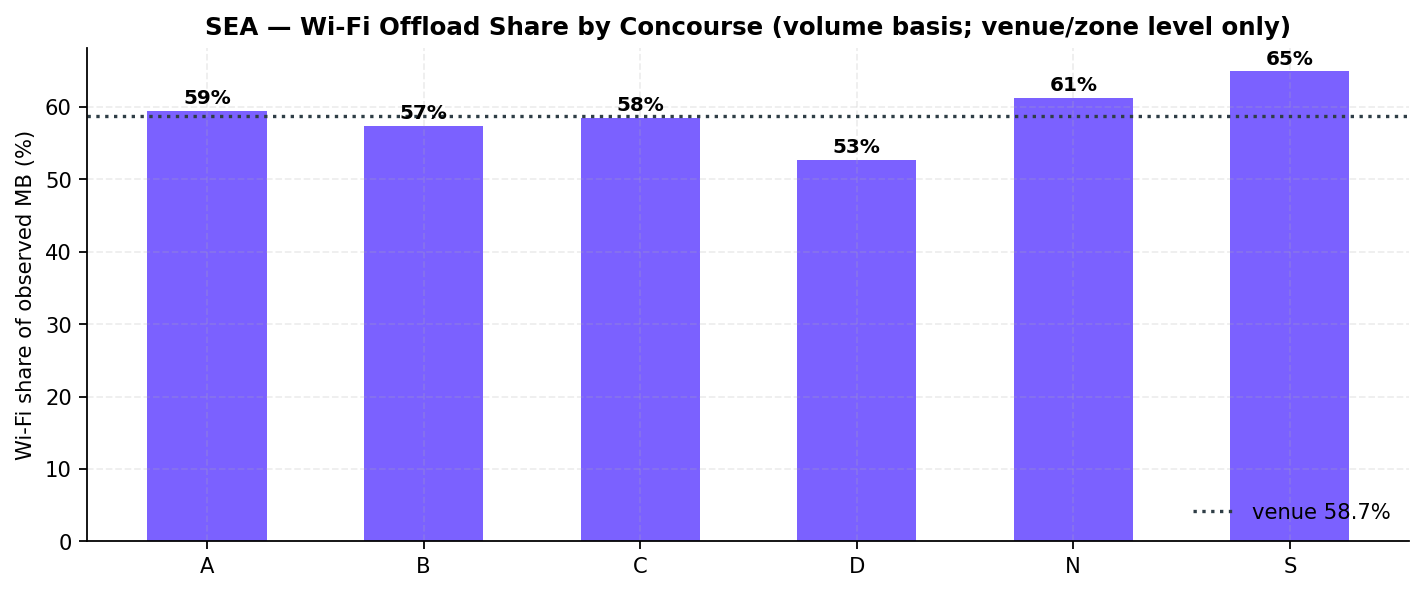
Venue-wide, 58.7% of observed data volume moves over Wi-Fi (Σ Wi-Fi MB ÷ Σ all MB,
summed across the three carrier sampling panels). Concourse-proximate tiles blend to 58.6%; the
remaining on-airport tiles (landside, garages, periphery) run 70.9%.
Fig. 12 · Observed data volume by zoneSource · Ookla
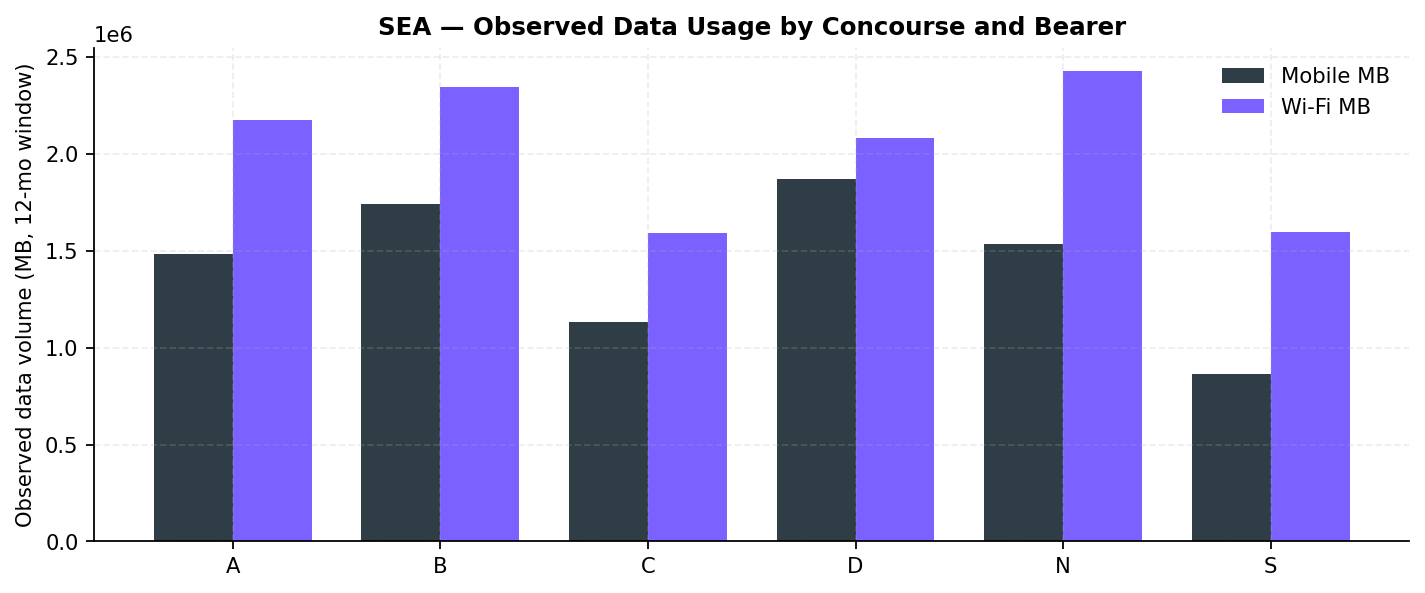
Fig. 13 · Wi-Fi share of observed data volume by concourseSource · Ookla
Locked rule: no per-carrier offload
Offload is computed at venue and zone level ONLY. The export does not attribute Wi-Fi usage to any
cellular carrier's subscribers, so per-carrier offload is not derivable at any aggregation and is never
implied here. The figure blends airport-run Wi-Fi with tenant and personal networks; it cannot
separate them.
Section 11
Carrier-asymmetry atlas
Worst-carrier tally per gate
Per gate, the atlas names the weakest carrier and the spread to the strongest.
T-Mobile is the worst carrier at 93 of 103 asymmetry gates. Spread compression at the named
gates is one of the acceptance criteria recommended for the Boldyn cutover plan (section 12).
Fig. 14 · Carrier-asymmetry atlas · worst carrier and spread per gateSource · Ookla
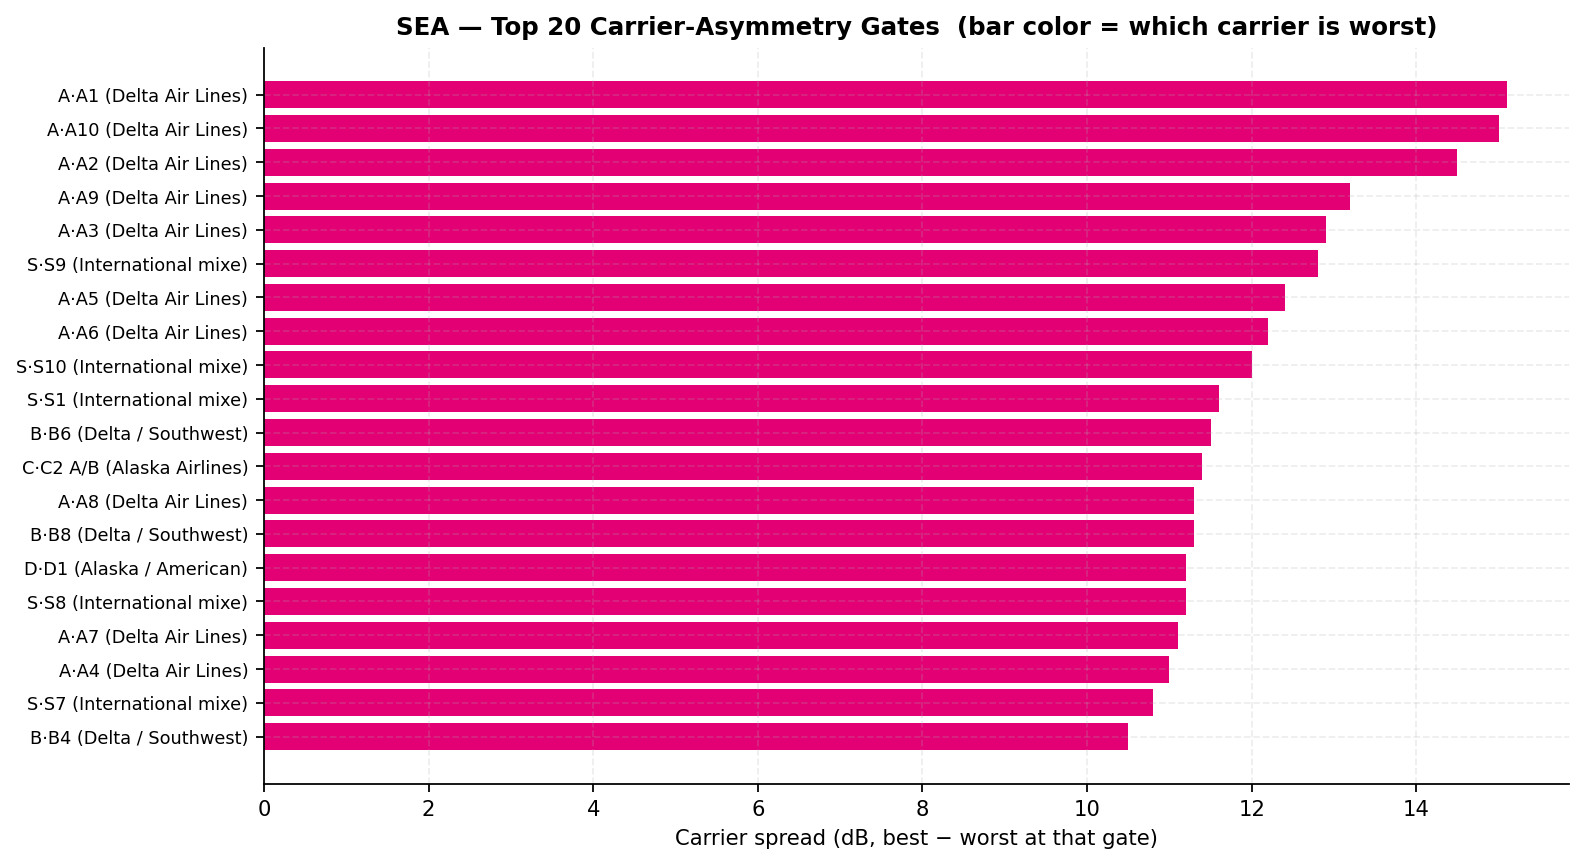
Window 2025-08-01 to 2026-07-31. Every published pair n ≥ 30.
Section 12
Recommendations
Ordered by leverage · each with an owner
Write the acceptance criteria into the Boldyn cutover plan now
Asymmetry-spread compression at the named gates, T-Mobile NR validation in the Alaska hub (C+N),
and the no-critical-gates floor. T-Mobile's hosted path is the largest single measurable lift
(17% of gates healthy today).
Owner · Port of Seattle + BoldynBaseline the AT&T legacy DAS before decommissioning
As-builts, PCI plan, re-tuning history. The incumbent profile is the parity bar for the new
system, and its documentation disappears at cutover.
Owner · Port of Seattle + AT&TAttest whatever explains Verizon's indoor-stronger profile — before cutover
Locate, attest, and document the path behind the Concourse-B dominance and indoor-stronger
medians (section 8). An unrecorded independent path decommissioned unexamined is the largest
transition risk in the record.
Owner · Port of Seattle + VerizonRe-measure with the identical instrument 90 days post-cutover
Same window length, same thresholds; Ookla's native date-range comparison renders the
before/after directly.
Owner · Imagine WirelessTreat Wi-Fi as a coexisting capacity layer in the new design
Venue offload is material (58.7%). Obtain controller telemetry to size it — no Wi-Fi node is even
recorded in the graph today.
Owner · Port of Seattle ITDecide the CBRS / private-wireless question alongside the DAS build
Not after it — retrofitting operational spectrum into a commissioned neutral-host design costs
more than designing it in.
Owner · Port of Seattle
Section 13
Methodology and audit trail
Thresholds · provenance · reproducibility
| Rule | Value |
|---|
| Signal ladder (locked) | Healthy ≥ −95 dBm · at-risk −95 to −110 dBm · critical < −110 dBm. SINR healthy ≥ 10 dB. |
| Minimum n | No chart or comparative claim ships on n < 30 tiles/points; smaller cells are reported as counts with n visible, never ranked. |
| Metric discipline | Signal-layer only: no throughput, latency, or user counts are in this export and none are claimed. Per-carrier Wi-Fi offload is not derivable and never implied. |
| Sourcing | Measured facts reproduce from raw exports; transcribed facts carry capture dates; facts sourced from the Imagine knowledge graph are tagged inline as such. |
| Site Finder caveat | Centroids are Ookla-estimated technology-layer positions, not carrier registry data; LTE/NR layers on one structure appear as two entries. |
Audit trail
Every published measurement is independently recomputed from the raw pinned exports by
validate_sea_rev2_report.py: 36 checks PASS, 18 of 18 Tier-A claims covered. The full audit
dossier (22-claim lane-tagged ledger, methodology, provenance manifest, findings log, blind cold read,
agent-trace index) ships with the verification bundle: reproduce.sh run twice → 71 artifacts,
byte-identical CHECKSUMS.sha256. Deliverable subject to the two-lane human review gate; sign-off
status accompanies this issue.
⬇ Download the full report (PDF · 27 pp · rev 2)